
Table of Contents
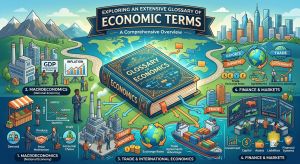
Exploring an Extensive Glossary of Basic Economics: A Comprehensive Overview
Economics plays a vital role in driving our day-to-day existence, controlling everything from the costs we pay and the jobs we choose to business operations and government policies. Grasping the key ideas of basic economics is the basis for shaping well-informed decisions. To clarify over 100+ key basic economics terms in an easy, coherent, and accessible manner. Every topic provides a clear definition, a brief breakdown, and an everyday scenario to help readers grasp economic ideas without complex wording. The guide covers a big range of subjects, including microeconomics, macroeconomics, public finance, banking, international trade, development economics, financial markets, and many other core branches of economics.
Microeconomics vs Macroeconomics Cross-examination Table:
| Component |
Microeconomics | Macroeconomics |
|---|---|---|
| Priority |
Individual units such as Single person, Company | The broader economic landscape (Country level) |
| Main drivers |
Demand, Supply, (Goods and Services) Pricing | GDP, Inflation, Unemployment |
|
Illustration |
Price of a computer laptop | National income of Pakistan |
100+ Essential Economics Terms:
grasping basic economics becomes simple when they are articulated with clarity and structure. Categorizing it into 12 well-designed sections. This layout helps reader quickly find the topics they need and grasp economic principles systematically without any ambiguity.
All basic economics terms provide a simple definition, a short summary, and a concrete illustration to make learning simple.
Note: This glossary is crafted to demystify economic ideas. every term includes a short definition, a brief breakdown, and an empirical example to help readers grasp the ideas effortlessly. All featured topics directly pertain to the basic economics combining to create powerful and definitive economic glossary. These basic economics are as under:

1.Basic Economics
1. What Is Scarcity?
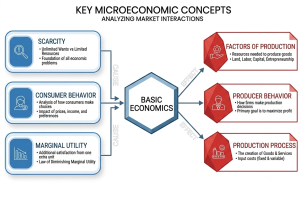
Scarcity is caused because human desires are boundless, yet the resources required to fulfill them remain inherently scarce. Since resources such as land, labor, capital, time, and raw materials are finite, individuals, businesses, and governments cannot manage every basic need and desire at the same time. Consequently, decisions need to be taken on how limited resources should be distributed to maximize their impact.
Explanation
Examining scarcity is deemed essential in the realm of economics as it delves into the fundamental factors driving the necessity for decision-making and trade-offs. Every economy, regardless of its riches or position, is susceptible to the limitations of scarcity in one way or another. Natural resources, skilled workforce, technology, and financial assets are all finite, whereas the demands and desires of individuals are ever-expanding. This disparity necessitates that both individuals and entities carefully consider their choices and optimize the utilization of the resources at their disposal.
Illustration
A town faces a severe, extended drought that drastically depletes its water reserves. As the useful water cannot reach the needs of all households, farms, and industries, authorities implemented water control and promoted sustainability. These conditions illustrate scarcity because a limited resource requires optimal allocation among conflicting priorities.
2. What Is Choice?
Choice refers to the decision-making process of selecting the best option from multiple options because resources like time, capital, and materials are limited. As humans cannot satisfy all their wants, they must choose which option yields the greatest benefit. Consequently, every economic decision fundamentally involves making a choice.
Explanation
Choice is a fundamental concept in economics because scarcity makes decision-making essential. Buyers choose how to spend their income, businesses choose what products to manufacture, and governments examine how public resources should be allocated. Each choice involves giving up the next best alternative, which introduces the concept of opportunity cost.
Illustration
A country has enough wealth to buy either national defence or healthcare systems, but cannot afford both. Choosing national defense over healthcare systems demonstrates the necessity of economic choice.
3. What Is Opportunity Cost?
When individuals, businesses, or governments opt for one choice over another, they incur an opportunity cost, defined as the value of the alternative they forgo. Due to resource constraints, every decision entails relinquishing a potential advantage.
Explanation
Opportunity cost helps people calculate the accurate cost of their planning. It concerns daily life as well as business and government decisions. For instance, spending money on one program means giving up the possibility of investing in another. Grasping the concept of opportunity cost promotes the best resource utilization and more strategic decision-making.
Illustration:
By choosing to cultivate wheat on a plot of land instead of corn, the farmer forgoes the potential profit associated with growing corn. This foregone profit represents the opportunity cost of opting to produce wheat.
4. What Are Resources?
In the production of goods and services, resources play a crucial role as they encompass natural, human, and man-made assets. Given their finite availability, efficient management is essential to meet human needs. Economics commonly labels these resources as the factors of production.
Explanation
Resources are crucial for every economic activity. They encompass natural resources like land and water, human resources like labor and skills, and man-made resources like machinery and technology. Since resources are scarce, businesses and governments must make strategic decisions on how to allocate them optimally. Effective resource management enhances production capacity, drives economic growth, and enhances public welfare.
Illustration:
A furniture factory makes use of timber, skilled workers, machines, and production facilities to assemble tables and chairs. These represent economic resources.
5. What Are Factors of Production?
In the production process, various elements come into play to generate goods and services. These components encompass land, labor, capital, and entrepreneurship, all collaborating harmoniously to yield economic value.
Explanation
All business entities rely on the factors of production to work effectively. Land supplies raw materials, labour contributes physical and intellectual effort, capital encompasses equipment, machinery, and infrastructure, and entrepreneurial spirit coordinates these elements and bears business risk. In the absence of these fundamental components, the production of goods and services is impossible.
Illustration:
A technology firm leverages office premises (land resources), skilled developers (labor force), computer systems and servers (capital assets), and the founder’s innovative vision and willingness to take risks (entrepreneurial spirit) in developing mobile applications.
6. What Is Marginal Utility?
The concept of marginal utility pertains to the extra satisfaction or advantage that a consumer gains from the consumption of an additional unit of a product or service. Economically speaking, marginal utility sheds light on the fluctuations in consumer contentment with the increase in product quantity.
Explanation
Marginal utility is one of the most important economics terms that is utilized in buyer theory because it determines purchasing decisions. The initial unit of a product yields the highest satisfaction, whereas each subsequent unit delivers progressively less marginal utility.This concept known as the Law of Diminishing Marginal Utility. Businesses use this idea to grasp consumers preferences,determine pricing, and devise targeted marketing frameworks. Buyers also depend on marginal utility when evaluating whether the value of buying another unit is worth its cost.
Illustration:
The consumption of the first glass of water produces the highest marginal utility for a person experiencing acute thirst. The second glass still provides pleasure; its utility diminishes, yet the third or fourth glass yields minimal additional satisfaction. Perfectly demonstrating the law of diminishing marginal utility.
7. What Is Consumer Behavior?
When individuals make choices on which goods and services to purchase, how much to allocate for spending, and the timing of their purchases, it reflects their consumer behavior. Various factors such as income levels, pricing, personal preferences, cultural influences, and individual needs play a role in shaping these decisions.
Explanation
Consumer behavior helps economists and businesses make different consumption decisions. Factors like product quality, brand equity, strategic advertising, lifestyle preferences, and prevailing economic conditions all influence consumer choices. Businesses study consumer behavior to promote products, create effective marketing strategies, and fulfill consumer demands. Analyzing customer preferences also helps regulate prices of products and evaluate economic trends.
Illustration:
A consumer contrasts the value and cost of two smartphones before buying the one that offers the best price for money. Provides deep insight into consumer dynamics.
8. What Is Producer Behavior?
When it comes to producer behavior, it pertains to the choices that companies make in terms of producing, pricing, and selling goods and services with the aim of optimizing profits through efficient utilization of resources.
Explanation
Producer behavior is primarily driven by production costs, market demand, comitative dynamic, technological advancement, and regulatory policies. Businesses determine how much to manufacture, which products to buy, and what prices of product root on assume profits and customers demand. Systematic producer behavior helps less costs, impressive product quality, and high competitiveness. Grasping producer behavior is key for survey market show and business policy.
Illustration:
A furniture manufacturer ramps up output ahead of the holiday season and anticipation of heightened customer demand. This production decision directly illustrates producer dynamics.
2. Demand and Supply

1. What Is Demand?
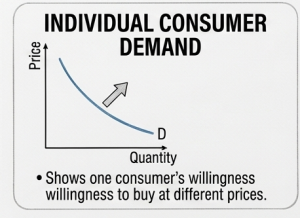
Demand is the volume of goods and services that customers are willing and able to buy at various prices during a specific time period. Demand captures both the willingness to buy a product and the purchasing power to pay for it.
Explanation
Demand is one of the key concepts of basic economics and plays a vital role in examining market prices. Usually, when the price of a product is lower, consumers are willing to buy more of it, while higher prices generally reduce the quantity demanded. As well as price, demand is also influenced by income, buyer behavior, population, strategic advertising, and the prices of cross-elastic commodities. The firm assesses consumer propensities to generate accurate sales projections and optimize production schedules.
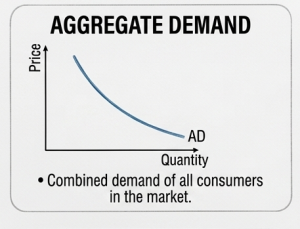
Illustration:
When the price of sugar falls, many consumers buy more because it becomes affordable. This proliferation in purchases directly illustrates the fundamental law of demand.
2. What Is Supply?
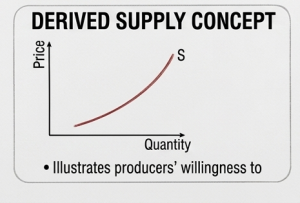
Supply is the volume of goods and services that the producers are willing and able to offer for sale at various prices during a specific time period. Supply captures both the willingness to sell and to produce goods and services profitably.
Explanation
Supply is basic economics that explains the key principle of how producers react to changes in market prices. As usual, higher prices encourage businesses to increase production to maximize profit margins, yet lower prices may lower output. Supply is also impacted by the cost of production, technological advancement, government regulations, taxation, subsidies, and the number of competitors in the market. Grasping supply dynamics enables firms to optimize production and navigate market trends effectively.
Illustration:
A rise in rice prices incentivizes farmers to allocate more resources toward rice production in the next agricultural cycle. This change in production directly illustrates the principle of supply.
3. What Is Market Equilibrium?
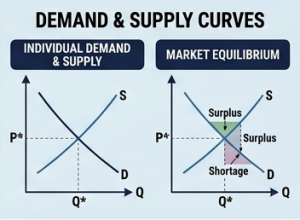
Market equilibrium is the point at which the volume of goods and services demanded by buyers is equal to the quantity supplied by producers. At this point, the market meets and establishes an equilibrium price, removing both shortages and surpluses.
Explanation
Market equilibrium is a key theory in economics because it examines the market price of goods and services. When demand and supply are equal, consumers can purchase the amount they want, and sellers can sell the amount they make. If prices are higher than the equilibrium level, a surplus may arise, while prices lower than the equilibrium level can create shortages. Businesses and governments monitor market equilibrium to understand price fluctuations and make well-informed economic decisions.
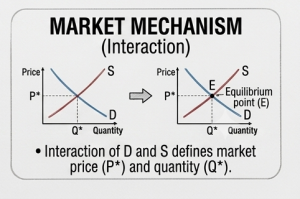
Illustration:
A bakery provides 500 buns daily, and consumers buy exactly 500 buns at the prevailing market price. This equality demonstrates the market equilibrium.
4. What Is Price Mechanism?
The price mechanism is the system by which the forces of demand and supply regulate the prices of goods and services in a market economy. It helps allocate resources effectively without direct government intervention.
Explanation
The price mechanism behaves as an indicator for both consumers and producers. When demand is higher, prices are usually high, which incentivizes businesses to produce more. Conversely, when demand is lower, prices tend to fall, leading sellers to reduce output. This constant change helps equilibrate demand and supply while efficiently allocating the goods and services demanded by customers. To emphasize how it drives the system price mechanism is primary engine of a free market economy.
Illustration:
When the demand for electric vehicles is higher, their prices may jump. These higher prices incentivize manufacturers to increase production, thereby demonstrating the price mechanism in action.
5. What Is Elasticity of Demand?
Elasticity of demand quantifies how much the consumption level of goods changes as a consequence of their price. It reflects whether consumers are extremely sensitive or unresponsive to price changes.
Explanation
Elasticity of demand enables businesses and economists to grasp buyers’ purchasing patterns. Alternative commodities, like soft drinks, generally have elastic demand because consumers can easily shift brands when prices are higher. By comparison, inelastic necessities such as medicines frequently have inelastic demand because people must sustain their consumption regardless of price increases.
Illustration:
If the price of a luxury car rises significantly and consumers pivot to alternative options, the quantity demanded will experience a substantial decline, confirming that the commodity has highly elastic demand.
6. What Is Elasticity of Supply?
Elasticity of supply quantifies how much the quantity supplied of a product changes as a consequence of its market price. It measures the flexibility of the seller to adjust output levels when prices fluctuate.
Explanation
Elasticity of supply is determined by factors like operational scale, factor mobility, technological advancement, and time frame. If a manufacturer can rapidly raise output when prices are higher, supply is relatively elastic. Conversely, if production cannot be easily expanded due to limited resources or total throughput constraints, supply is inelastic. Businesses use this idea to plan manufacturing and adapt quickly to fluctuating market dynamics.
Illustration:
A shoe manufacturing entity can ramp up production capacity when market prices experience an upward trend. This demonstrates an elastic supply.
7. What Is Cross Elasticity of Demand?
Cross Elasticity of Demand calculates how the quantity demanded of one good changes when the price of another correlated product shifts. It reflects the interdependence between two goods and helps clarify how consumers react when the price of one good rises or declines.
Explanation
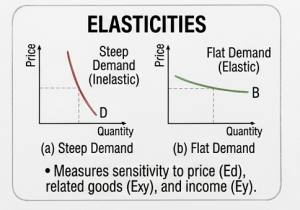
Cross elasticity is majorly utilized to distinguish whether two goods are alternatives or complements. If the price of one commodity is high and the demand for another good increases, the two products are substitutes. For instance, if the price of Coke increases, some buyers may buy more Pepsi instead. As a result, cross elasticity is positive. Conversely, if the price of one individual good escalates and the demand for another ware diminishes, the merchandise are interdependent. For example, if the price of printers is high, fewer people may buy them, which can decrease the demand for ink cartridges as well.
Illustration:
If the price of brand A bottled water is high, consumers may shift to brand B. This may show an increase in demand for brand B, indicating a positive cross-elasticity between the two labels.
8. What Is Income Elasticity of Demand?
Income elasticity of demand quantifies how the volume of consumption of goods and services shifts when the purchasing cohort’s income changes, while other factors remain constant.
Explanation
Income elasticity facilitates the classification of goods based on disposable income. Normal goods typically experience an increase in demand as income rises, while inferior goods may witness a decline in demand because consumers pivot to premium alternatives. Luxury commodities generally have high income elasticity because demand expands substantially with rising incomes. Businesses use this idea to forecast customer consumption habits and align output relative to market dynamics.
Illustration:
As consumer incomes rise, households are choosing to purchase new cars instead of utilizing public transit. This shift in demand demonstrates the purchasing cohort’s income elasticity of demand.
9. What Is Consumer Surplus?
Consumer surplus is the threshold differential between a buyer’s propensity to spend on goods and services, and the prevailing market rate. It signifies the net benefit that economic agents obtain from a transaction.
Explanation
Consumer surplus occurs when consumers buy a good at a lower price than their marginal willingness to pay. The larger the disparity between the propensity to spend and the equilibrium price, the more substantial the accrued economic welfare gain. This idea enables economists to evaluate socio-economic well-being. Businesses and regulatory authorities monitor consumer surplus to design fair pricing models, evaluate tax policies, and measure buyer satisfaction within highly competitive industries.
Illustration:
A customer is willing to pay $80 for a cable but purchases it in the course of a transaction for $60. The $20 differential is the consumer surplus.
10. What Is Producer Surplus?
Producer surplus is the divergence between the price a seller derives for trading a good or service and the lower amount they maintain as a marginal willingness to supply. It exemplifies the welfare dividend from selling goods above their minimum reservation price.
Explanation
Producer surplus high when equilibrium price is higher than acquisition expenditures or the nominal selling price. It represents the pecuniary gains a maker benefit from join in the market. Economic thinkers use accrued producer welfare to evaluate allocative and productive efficiency, business advantage, and the consequential impacts of regulatory authorities like statutory levies and financial endowments. Maximum maker surplus often elevated output levels and the deployment of corporate resources for enterprise development.
Illustration:
An agriculturalist is maintains willingness to supply a bag of wheat for $70, but the prevailing market-clearing price is $80. The $10 divergence constitutes the producer surplus.
11. What Is Price Ceiling?
A Price ceiling is a government-imposed maximum price limit that producers are permitted to charge for a good or service. It is generally implemented to ensure key commodities remain low-cost for buyers.
Explanation
A price ceiling is binding only when it is depressed beneath the equilibrium level. Whereas it saves buyers from paying a huge amount, it can also diminish producer incentives to supply goods, manifesting as a structural supply deficit. Sovereign authorities impose price ceilings on goods and services like rent, health, and essential food commodities in natural crises or periods of hyperinflationary pressures.
Illustration:
A government mandates stabilization ceilings at monthly cyclical intervals for rent for accommodation in metropolitan areas to render housing more affordable. This housing rental threshold is an example of a price ceiling.
12. What Is Price Floor?
A price floor is a government-imposed price above the equilibrium price, at which a good or service cannot be liquidated. It is presented to safeguard manufacturers and ensure they accrue an economically viable income.
Explanation
A price floor is binding only when established above the prevailing market-clearing equilibrium. It augments manufacturers’ factor rewards but may lower consumer demand because of increased prices. In isolated economic contingencies, mandated price floors produce surpluses when producers supply more goods than buyers are willing to buy. A pervasive market illustration incorporates low wage laws and assured prices for agro-based outputs.
Illustration:
A government assures agrarian producers a high price for wheat when market prices fall too low due to market dynamics. This guaranteed price is a price floor.
13. What Is Shortage?
Shortage manifests when the consumer requisition of goods or services surpasses the producer output allocation at the spot market rate, leading to allocative constraints.
Explanation
Shortages are frequently severe when prices are maintained below the market-clearing point by means of regulatory price intervention or when demand immediately increases whereas supply remains constrained. Climate anomalies, distribution network fractures, and unforeseen shifts in buyer priorities can also induce market deficits. Commercial entities must adapt to shifting dynamics, whereas public authorities can be assumed to review economic strategies to recover market equilibrium.
Illustration:
Concurrently with a heatwave, the demand for electricity escalates rapidly, but energy output remains limited, driving energy shortfalls.
14. What Is Surplus?
Surplus takes place when the market supply of goods or services outweighs the market demand at the prevailing market price. In this market, manufacturers hold more goods than buyers are willing to purchase.
Explanation
Surpluses generally arise when prices exceed the equilibrium threshold. Market surplus can compel suppliers to lower prices, decrease output, or provide financial incentives to deplete excess reserves. In perfectly competitive arenas, supply surpluses are frequently transient because they boost consumer requisition and restore market equilibrium.
Illustration:
A smartphone producer makes more phones than buyers buy during the year. The excess supply residual inventory in logistical centers reflects a market surplus.
3. Macroeconomics
Macroeconomics is the sector of economics that studies the whole economy instead of a single buyer or firm. It concentrates on widespread economic problems like inflation, unemployment, economic growth, national income, fiscal policy, monetary policy, poverty, and international trade. Grasping macroeconomics helps determine how decision makers and economic factors impact trading, households, and the entire quality of life.

1. What Is Inflation?
Inflation is the continuous compounding acceleration in the aggregate price index of goods and services secularly, which decreases the domestic real purchasing capacity. During inflationary periods, buyers need more money to buy the same volume of goods and services relative to the historical baseline.
Explanation
Inflation is one of the pivotal macroeconomic indicators because it impacts households, firms, and regulatory authorities. It can take place in response to demand-pull mechanisms, marginal factor outlays, or monetary expansionary. Stable price inflation is usually categorized as a reflection of sustainable market growth. Conversely, accelerated price instability can erode living standards, drive escalating resource-acquisition expenditures, and generate financial volatility.
Real-World Case Studies (2023-2024):
The practically disastrous inflation rate can be noticed via the international economic trajectories of Pakistan and Zimbabwe during the 2023-24 financial periods. In Pakistan, aggregate price movement-the main cost-of-living increase-reached an extraordinary multi-decade apex of 35.37% in March 2023, acutely corroding household buying power and obliging a contractionary monetary strategy by the central bank. Simultaneously, Zimbabwe practiced core-currency framework devaluation and critical output-oriented stance dislocations, pushing its domestic inflation indicators toward sovereign-currency collapse thresholds before undergoing drastic monetary reform. These concurrent examples illustrate how meteoric policy easing, in tandem with economic volatility, directly undermines well-being.
Illustration:
If a bun costs $2 during the current fiscal period but escalates to $2.30 across the successive fiscal horizon whereas household revenue remains stagnant. This variance serve as a standard economic case study of inflation.
Inflation Rate Analogy Table:
This table presents an evaluative analysis of 2026 inflation trends in Pakistan and India, highlighting the basic economic factors and price fluctuations affecting both economies.
| Attributes |
Pakistan (Outlook 2026) | India (CY 2026) |
|---|---|---|
| Overall Inflation |
9.2% – 11.2% | 4.3% – 4.5% |
| Adjusted Inflation Rate | 8.5% | 4.3% |
| Basic Driver | Retail Market Forces & Real Estate Pricing |
Agricultural Prices & Climate Factors |
2. What Is Deflation?
Deflation is a sustained downward adjustment in the aggregate price index secularly. Concurrently with this contractionary phase, real value of the monetary unit rises because domestic units secure enhanced pecuniary liquidity command.
Explanation
Deflation generally arises when aggregate consumer demand, the aggregate money supply, or market supply outweighs consumer demand. Even though diminished price thresholds appear superficially advantageous, an extended downward price spiral can slow and constrain macroeconomic expansion because market agents retard commercial consumption in anticipation of further price drops. Firms may encounter a reduction in aggregate revenues, disincentivizing structural scaling, compressing output levels, and accelerating unemployment metrics. For this result, economic thinkers usually perceive negative inflation as highly disruptive to systemic equilibrium.
Illustration:
If an LCD commands a nominal transaction value of \$680 during the current fiscal period but depreciates to \$640 across successive temporal horizons. Serves as a microeconomic reflection of a broader, secular deflationary phase.
3. What Is Disinflation?
Disinflation is a slower price growth within the compounding inflation vector, an ongoing baseline escalation to high but at a decelerated momentum than before. It does not signify that prices are decreasing.
Explanation
Disinflation arises when inflation slows from a positive territory, never dropping into a negative rate, yet maintains a positive trajectory. To illustrate, if inflation drops from 7% to 3%, prices are demonstrating an uninterrupted escalation, but with moderated velocity. Regulatory authorities frequently target disinflation when inflation becomes profoundly elevated. Controlled disinflation facilitates price equilibrium without triggering the economic problems correlated with deflation.
Illustration:
The annualized inflationary trajectory has fallen from 10% in the preceding fiscal year to 5% this year. The economy is navigating disinflation as prices are continue escalating but at a moderated velocity.
4.What Is Stagflation?
Stagflation in which increased inflation, anemic output velocity, and pronounced labor-market slack transpire concurrently. It is deemed one of the most severe systemic disruptions, as these scenarios are structurally contradictory.
Explanation
Stagflation is commonly precipitated by adverse factor supply shocks, increasing output costs, or suboptimal fiscal interventions. Within a stagflation environment, the prices of goods and services continue to rise, whereas firms have low output and employment. Consequently, businesses face increased input costs, compressed profits, and economic growth stagnates. Central bankers grapple with an intractable remedy for an intractable anomaly that may increase unemployment.
Illustration:
Assuming that fuel prices escalate aggressively, inflating input expenses for market suppliers. Firms lower production and rationalize human capital outlays, whereas the prices of daily goods persist in increasing, this condition is an illustration of stagflation.
5. What Is Hyperinflation?
Hyperinflation is an exponential and unbridled surge in the general price level of goods and services within a compressed timeframes. It appreciably decreases the real value and purchasing power of currency.
Explanation
Hyperinflation generally arises when regulatory authorities print huge amounts of money without a proportional increase in economic output. Amidst hyperinflationary crises, baseline transaction values scale precipitously higher on a diurnal or even horary basis, rendering it intractable for consumers and firms to plan their spending. Liquid reserves depreciate rapidly, wages lag behind escalating transaction values, and the national currency depreciates aggressively. Severe uncontrolled inflation can compromise systemic macroeconomic equilibrium and lead nations to use foreign-denominated assets or direct commodity exchange.
Illustration:
If the prices of oil during geopolitical conflicts rise from $2 to $12 within a few days as a result of an aggressive supply disruption, the economic system is navigating hyperinflation.
6.What Is Recession?
Recession is a macroeconomic contraction in basic economics that is characterized by a sharp decline in economic output, a decrease in consumer spending, an increase in unemployment, and a drop in business investment.
Explanation
A recession generally arises when firms reduce aggregate output as a result of a decrease in demand. Businesses may lower investment, curtail hiring, and restrict output to regulate costs. Job cuts and the contraction in disposable income lead to compressed demand and further slow economic growth. Regulatory authorities frequently intervene in economic downturns by escalating state outlays, lowering borrowing costs, or implementing countercyclical interventions to stimulate growth.
Illustration:
A nation has been experiencing contracting commercial revenues, high unemployment, and declining economic growth over a prolonged duration. These market dynamics indicate that the economy is in a recession.
7. What Is Economic Depression?
An economic depression is a protracted and acute contraction in the economic system, signaled by tremendously high unemployment, diminishing aggregate output, a retrenchment in private consumption, and pervasive firm insolvencies. It is more severe and structurally enduring than a standard economic downturn.
Explanation
A systemic depression materializes when a recession persists indefinitely without a structural rebound. Amidst a depressionary phase, firms liquidate, capital expenditures diminish, and labor-market slack remains chronically elevated. Consumer sentiment deteriorates, compressing aggregate expenditures and further dampening economic velocity. Regulatory authorities generally deploy substantial fiscal stimulus and expansionary monetary frameworks to catalyze growth and reinstate macroeconomic stability.
Illustration:
Throughout a protracted macroeconomic cataclysm, labor-market slack spikes to unprecedented thresholds, and aggregate output undergoes a multi-year contraction. Such a scenario epitomizes a structural economic depression.
8. What Is Economic Growth?
Economic growth is the expansion in a nation’s aggregate output trajectory. It is conventionally quantified by the escalation rate of Gross Domestic Product (GDP).
Explanation
Economic growth signifies a country’s ability to manufacture more goods and services relative to preceding periods. It is precipitated by endogenous factors like technological advancement, capital formation, an increase in total factor productivity, high-skill human capital, and optimized use of yield-generating capital. Sustained structural growth stimulates workforce utilization, elevates household incomes, promotes material well-being, and fortifies fiscal solvency. Simultaneously, economic escalation should also be maintained to shield extractable primary inputs and socioeconomic welfare.
Illustration:
If a country’s GDP rises from $600 billion to $640 billion in one fiscal year as a result of expanding aggregate output and heightened capital formation, the macroeconomic framework has navigated an expansionary trajectory.
9. What Is Economic Development?
Economic development is the mechanism of promoting a country’s socioeconomic welfare and material well-being, through elevated household incomes, quality of education, enhanced healthcare, advanced logistical and industrial infrastructure, and enduring and non-inflationary market prospects.
Explanation
Economic growth prioritizes high output, whereas economic development evaluates systemic enhancements in a nation’s quality of life. It incorporates poverty alleviation, stimulates job creation, optimizes public goods and infrastructure, drives equitable revenue mobilization and safeguards environmental sustainability. Authorities regularly implement strategic interventions to support long-term socio-economic progress.
Illustration:
A country invests in education, health, infrastructure and job creation programs aiming at poverty alleviation and enhancing the quality of life. These measures signify economic development.
10. What Is Gross Domestic Product (GDP)?
Gross Domestic Product is the entire market value of all final goods and services generated within a nation’s boundaries during a period, which is a quarter or one fiscal year.
Explanation
GDP is one of the most widespread macroeconomic gauges. It calculates the shape and health of an economic system by measuring the aggregate domestic output. Authorities, financiers, and economic thinkers use GDP to benchmark economic progress, to cross-examine economies, and to evaluate policy interventions. A high GDP usually demonstrates an economic boom, whereas a decreasing GDP may reflect economic retrenchment.
Illustration:
If all firms in a country generate the aggregate value of commodities and services valued at $3 trillion in an annual horizon, the nation’s GDP for that year is $3 trillion.
Real World Example in Tabulated Form:
This table shows a cross-country economic performance review of Pakistan’s and India’s GDP Statistics, organized in a clear format to support readers in easily calculating and grasping key economic indicators.
| Characteristic | Pakistan (FY 2025-26) | India (FY 2025-26) |
| GDP Growth Rate | 3.7% | 6.5% |
| Nominal GDP | $452.1 Billion | $4.15 Trillion |
| PPP GDP | $2.16 Trillion | $18.90 Trillion |
| GDP Per Capita Income | $1,901 | $2,813 |
| Economic Drivers | Textile outbound trade, Farming rebound | Information technology operations, Industrial infrastructure & Capital Development |
11. What Is Gross National Product (GNP)?
Gross National Product (GNP) is the aggregate market worth of all finished goods and services generated by a country’s inhabitants and firms over a designated time frame, irrespective of whether the output is realized domestically or internationally.
Explanation
GNP evaluates by a country’s citizens regardless of territorial presence. It comprises accrued revenue by inhabitants abroad but omits income earned by foreign economic agents operating domestically. Analysts use GNP to quantify the cumulative economic input of a nation and firms in the global economic arena.
Illustration:
A U.S firm earns revenue from its factory in another state. Those profits are integrated into the United States’ GNP because they pertain to an American business.
12. What Is Net National Product (NNP)?
Net National Product (NNP) is the aggregate monetary valuation of entire finished goods and services generated by a state’s inhabitants, after adjusting for asset degradation, which is the wealth depletion in capital stock valuation,of fixed capital assets throughout their economic lifespan.
Explanation
NNP furnishes a more correct evaluation of a nation’s economic growth as a result of its constituents for the depreciation for fixed capital assets. Upon accounting for the consumption of fixed capital within Gross National Product, analysts can assume the factual net domestic output accessible for private expenditure and capital accumulation. NNP is instrumental in measuring perennial economic progress and long-run gross national revenue.
Illustration:
If a country’s GNP is $800 billion and the Consumption of Fixed Capital is $80 billion, its Net National Product (NNP) is $720 billion.
Net National product(NNP)=GNP-Consumption of Fixed Capital (CFC)
GNP=$800
CFC=$80
NNP=$720
13. What Is National Income?
National income is the aggregate accrued earnings by the inhabitants of a state from the output of goods and services over a designated timeframes, generally one year. It comprises the components of national income (wages, rent, interest, and profits).
Explanation
National income is used to assess a nation’s economic progress and the standard of subsistence. It reflects how much revenue is produced through economic participation in a domestic economic system. Economic thinkers and regulatory authorities use accrued earnings to measure basic economic development, benchmark countries, and draft government budgetary policies. A rising national income usually signals a robust and high-performance macroeconomic framework.
Illustration:
If labour, firms, and asset holders aggregate, derive $0.5 trillion via aggregate factor returns-namely wages, profits, rent-and annual yield on capital, the cumulative figure encapsulates the gross national income.
14. What Is Gross Value Added (GVA)?
Gross Value Added (GVA) is the monetary valuation of goods and services generated by a firm, company, or sector subsequent to deducting the cost of in-process intangibles used in output. It quantifies the factual economic footprint of every part of the economic system.
Explanation
GVA facilitates economic thinkers to examine how much value each firm contributes to the sovereign. It is formulated by deducting the price of productive inputs and other industrial yield from the total value of output. Authorities use GVA to evaluate the progress of various parts like the (primary economy) Agriculture, (secondary) manufacturing, and (Tertiary economy) services. high GVA generally signifies an augmented systemic efficacy and robust productive dynamism across the macroeconomic framework.
Illustration:
A pharmaceutical company produces medicine tablets valued at $250,000 and incurs $100,000 on primary input costs. Its Gross Value Added (GVA) is $150,000.
GVA=Gross Output-Intermediate Consumption
Gross Output= $250,000
Intermediate Consumption=$100,000
GVA=$150,000
15.What Is Per Capita Income?
Per capita income is the average realized inflow per individual in a state throughout a given fiscal or calendar cycle. It is formulated by dividing the national accrued earnings by the total inhabitant count.
Explanation
Per capita income is frequently leveraged for cross-national appraisals of the standard of living in a country. While it furnishes a mean economic compensation metric, it does not capture how income is divided among the population. An increase in per capita income usually signals heightened socio-economic well-being, though structural wealth disparities may persist.
Illustration:
If a state’s national income is $600 billion and its total inhabitant Count is 200 million, the average income is $3,000 per person.
Per Capita Income=National Income/Total Population
National Income= $600B
Total Population=200 million
Per Capita Income=$3,000
16. What Is Disposable Income?
Disposable income, fluid capital at the disposal of household economic agents, which remains accessible for consumption and asset accumulation, is derived subsequent meets all fiscal obligations.
Explanation
Disposable income explains the real value of liquid wealth and dictates allocation dynamics within an economic system. When disposable income is high, economic agent generally accelerate total outlays on commodities or augment deferred consumption. Conversely, a decrease in available income often leads to a decline in buyer expenditure and a slowdown in economic activity. Firms systematically audit the dynamics of fluid capital reserves because they directly affects demand for products and services.
Illustration:
A worker earns $400 per month and pays $100 in direct fiscal levies on earnings. The net fluid wealth $300 is the economic agent’s disposable income.
DI=Gross income-Direct taxes
Gross income= $400
Direct taxes=$100
DI=$300
17. What Is Unemployment?
Unemployment is a situation in which people who are proficient and capable of working at the current wage rate cannot find an appropriate job. Controlling it is one of the core drivers of a nation’s economic progress.
Explanation
Unemployment arises when the labor supply exceeds the demand for labor in a nation’s economy. This can be triggered by economic recessions, technological advancements, market fluctuations, or deep transformations in firms. The main categories of this issue include frictional joblessness, business cycle layoffs, and periodic workforce displacement fluctuations. Widespread labor market distress reduces family disposable income, diminishes public consumption, increases public welfare costs, and weakens economic development. Regulators try to mitigate labor underutilization through state financial strategies, central bank interventions, investor subsidies and tax breaks, and workforce expansion initiatives.
Illustration:
During an economic crisis, many firms decrease output and downsize their workforce. Those laborers who are proactively looking for jobs but have failed to find employment are considered unemployed.
18. What Is Economic Stability?
Economic stability is a situation in which an economic landscape faces stable output progression, stable inflation, price equilibrium, stable livelihood opportunities, and an effective economic system immune to macroeconomic shocks.
Explanation
Economic stability is vital for a long-term thriving economy because it produces a certain economic climate for buyers, firms, and market stakeholders. A robust domestic market preserves stable purchasing power, low unemployment, sustained macroeconomic expansion, and moderate inflation. Regulatory authorities improve financial stability by leveraging budgetary measures and credit regulations.
Illustration:
A country controls a yearly inflation rate of 2%, characterized by sustained gross domestic product expansion, alongside long-term workforce retention across multiple fiscal years. This signifies economic stability.
19. What is Economic Policy?
Economic policy refers to the activities and initiatives adopted by regulatory authorities to ensure market efficiency in the economic system and achieve core milestones, including sustained macroeconomic expansion, equilibrium prices, full employment, and economic development.
Explanation
Economic policy provides the framework for managing a country’s economy. Governments use various policy tools to influence production, employment, inflation, investment, and trade. The two main types of economic policy are fiscal policy, which involves government spending and taxation, and monetary policy, which is managed by the central bank through interest rates and money supply. Well-designed economic policies encourage investment, create employment opportunities, control inflation, and improve living standards.
Illustration:
A government reduces taxes to encourage business investment while the central bank lowers interest rates to stimulate borrowing and economic growth. These measures are examples of economic policy.
20. What Is Aggregate Demand?
Aggregate demand (AD) is the total demand for all finished goods and services generated domestically in an economy during a given period of time at various market prices. It signifies the total expenditure by consumers, firms, the government, and net exports.
Explanation
Aggregate demand is an important macroeconomic idea that evaluates the general demand for goods and services in an economy. It includes four main components: Household consumption, gross investment, government spending, and net foreign demand. When total demand is higher, firms respond by manufacturing more goods and services, which can lead to increased jobs and economic development. Conversely a reduction in aggregate demand may decreased output, higher unemployment, and economic activity may slow. The public sector and monetary authority use fiscal policy and macroeconomic stabilization policy to influence aggregate demand and foster sustainable economic growth.
Illustration:
Assume that buyer expenditures are high, firms increase induced investment, and the government spending is directed toward launching a major infrastructure project. These determinants boost overall spending in the economy, incentivizing businesses to scale up output and create more jobs for workers.
21. What Is Aggregate Supply?
Aggregate supply (AS) is the total volume of goods and services that firms are willing and capable to generating, within a domestic market over a defined timeframe across varying price points.
Explanation
Aggregate supply shows that the efficiency of an economy relies on determinants like workers, capital stock, technological advancement, primary commodities, output costs, and fiscal and monetary policies. Economists use specific timelines to tell the difference between short-run aggregate supply (SRAS), which encounters sudden volatility, and long-run aggregate supply (LRAS). In the short run, output can shift as output costs and prices vary. In the long run, aggregate supply depends majorly on the economy’s factor endowment and efficiency. An expansion in aggregate supply stabilizes price levels, while low or reduced production triggers inflationary pressures.
Illustration:
A nation maintains digital manufacturing frameworks that are accessible to industries to generate more commodities utilizing the available resources. As a result, the country’s potential aggregate supply expands.
4. Monetary Economics

1. What Is a Central Bank?
A central bank is the basic financial intermediary held accountable for maintaining a nation’s monetary regime. It governs the money supply, anchors interest rates, preserves the absence of inflationary and deflationary shocks, manages currency issuance, and supervises the commercial banking system to help economic stabilization.
Explanation
A financial intermediary plays a key role in sustaining a good economy. It uses monetary policy to rein in inflation and foster sustainable economic development, and to ensure financial stabilization. Even commercial banks, a central bank does not yield banking services reserve accounts to retail liquidity consumers. Instead, it serves as the government’s primary banker and supervises the nation’s financial institutions. It also functions as a systemic safety net, providing economic support to commercial banks during economic crises. Some of the most prominent examples of central banks include the Federal Reserve in the United States, the Bank of England, and the State Bank of Pakistan.
Illustration:
When inflation is high above the medium-term target level, the State Bank of Pakistan increases the policy interest rate to decrease lending and slow down inflation. This is an illustration of a central bank utilizing monetary policy.
2. What Is an Interest Rate?
An interest rate is the percentage charged by a lender for liability, or paid for fund mobilization over a maturity period. It is an indicator of the cost of borrowing or the real rate of saving.
Explanation
Interest rates determine lending, capital allocation, disbursal, and portfolio management, with widespread economic influence. When interest rates are decreased, borrowing becomes more economical, empowering buyers and firms to allocate capital. Increased interest rates make debt more premium, which contributes to decreasing inflation by dampening demand. Monetary authorities often align policy interest rates to maintain macroeconomic equilibrium and inflation targeting.
Illustration:
A bank facilitates a $100,000 loan at a nominal interest rate of 10%. The lender receives interest alongside the redemption of the principal amount.
Interest Rate Comparison Table:
This table presents a direct comparison of the 2026 monetary policy target rates between Pakistan and India, highlighting the distinct Central Bank strategies and borrowing structures in each economy.
| Core Evaluative Factors |
Pakistan’s Economic Outlook (2026) | India’s Economic Outlook (2026) |
|---|---|---|
| Primary Monetary Base Rates |
SBP Repo Rate: 11.50% | RBI Repo Rate: 5.25% |
| Central Bank Frameworks |
Structural Adjustments | Stable Outlook |
| Borrower Outcomes |
High Interest Overheads |
Normalized Mortgage & Credit Structures |
3. What Is Fiscal Policy?
Fiscal policy is the use of government expenditures and indirect levies to execute fiscal interventions which help drive macroeconomic performance, mitigate demand-pull inflation, foster employment opportunities, and maintain equilibrium in the aggregate economy.
Explanation
Fiscal policy is one of the most important economic tools. In a period of negative GDP growth, regulators may raise public expenditures or decrease taxes to incentivize consumption, employment, and mobilize private capital. Alternatively, when inflation increases, governments may reduce spending or increase taxes to slow down the economic system and stabilize prices. Fiscal policy is operationalized via the sovereign Budget and is managed by the fiscal policymakers. It can be expansionary (to catalyze the economy) or contractionary (to mitigate inflation and surplus demand).
Illustration:
In a period of negative GDP growth, a government inaugurates mega-development projects and enacts tax exemptions to foster employment opportunities and incentivize consumption. This reflects an expansionary fiscal policy.
4. What Is Monetary Policy?
Monetary policy is the activity by which a nation’s central monetary authority manages the market liquidity and borrowing costs to achieve economic goals like attaining price stability, mitigating demand-pull inflation, and preserving macroeconomic stability.
Explanation
Monetary policy is enforced by the governing authority. It modulates financing preferences, consumption, capital accumulation, and asset acquisition by deploying monetary aggregates and policy rate adjustments. When the economy slow down, the central bank may decrease interest rates and boost the money supply to promote lending and investment. When inflation arises too sharply, it may elevate the cost of capital and decline the money supply to control surplus demand. Monetary policy can also be expansionary ( accommodative and stimulatory) or contractionary (restrictive and tightening) contingent upon the economic situation.
Illustration:
If inflation arises above the central monetary authority’s target, it may elevate the policy interest rate. As lending becomes more premium, household consumption and firms’ induced investment slow down, helping to mitigate inflation. This is a stance of contractionary monetary policy.
Fiscal Policy vs Monetary Policy Differential Table:
Monetary policy controls financial resources through Central Banks to combat inflation, while fiscal policy uses government levies and stimulus spending aggregate economic growth.
| Factor | Monetary Policy | Fiscal Policy |
|---|---|---|
| Governed by |
Central Bank (SBP, RBI) | Government |
| Core Mechanisms |
Interest Rates, Lending Rate (Repo Rates) | Taxes, Government Expenditures |
| Primary objective |
Inflation & Exchange rate | Economic Development,Employment |
5. What Is Money Supply?
Total volume of money refers to the net amount of supply of money in an economy at domestic at a specific point in time. It consists of tangible money, specie, and digital holdings that can be used for consumption, retained earnings, and asset acquisition.
Explanation
The money supply is an important measuring tool in basic economics because it impacts consumer spending, corporate asset allocation, demand-pull inflation, and economic development. Central banks govern the money supply through monetary authority by adapting interest rates, performing systemic liquidity management, and modifying legal reserve ratios. Higher total money stock can catalyze economic processes, while a declining one can control inflation. Sustaining a prudent broad money supply is key to macroeconomic equilibrium and a prosperous economy.
Illustration:
During an economic crisis, a central bank hikes the money supply to encourage banks to lend more money. As lending and total volume of money increase, the economic recovery begins to accelerate.
6.What Is Liquidity?
Liquidity is the power of a corporation or financial intermediary to sharply liquidate assets into money without transaction costs. Cash is regarded as the most liquid asset because it can be used directly for transactions.
Explanation
Liquidity plays a key role in economic stability and daily financial activities. Private households require liquid assets to meet daily household expenses, while corporations require them to cover labor costs, input costs, and overhead. Financial institutions also require optimal asset liquidity to fulfill depositor redemptions. While assets like savings accounts represent readily accessible capital, immovable property as well as plant and equipment are non-liquid capital because they have low turnover velocity. Preserving financial solvency helps mitigate insolvency risk and supports optimal operational efficiency.
Illustration:
A depositor with $4,000 in a savings account can execute immediate transactions to disburse funds for clinical costs, which substantiates the asset’s high liquidity
7.What Are Open Market Operations?
Liquidity Management Operations (OMOs) are critical central bank interventions used to regulate the monetary conditions in the macroeconomic framework.
Explanation
Open market operations are one of the most impactful tools of monetary policy. When the central bank allocates capital to purchase risk-free assets, it executes a capital infusion into the banking system, creates a highly liquid environment, and incentivizes debt financing and investment. Conversely, during contractionary phases, liquidity absorption and contracting the money supply successfully control inflation. Monetary authorities regularly deploy OMO frameworks to maintain control of the money supply and foster long-run macroeconomic stability.
Illustration:
To catalyze economic activity, the central bank conducts expansionary open market operations. This expands the capital available to stimulate credit utilization and accelerate macroeconomic growth.
5.Public Finance
1.What Is Public Finance?
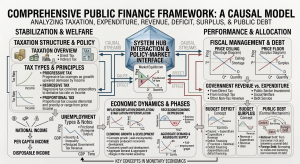
Public finance is a subsidiary unit of economics that studies how regulators collect and mobilize taxes to manage public funds and optimize budgetary distributions to provide public services and achieve economic goals. This field examines taxation, government spending, fiscal policy, and sovereign debt.
Explanation
Public finance plays a supporting role in enabling regulators to sustain macroeconomic equilibrium and enhance socioeconomic well-being. It delineates how the government mobilizes revenue through taxes and other sources of income, how it allocates its budget to foundational developmental sectors such as education, healthcare, infrastructure, and defense, as well as how it administers budgetary deficits or surpluses. Optimal capital allocation cultivates sustainable economic expansion, reduces income disparities in wealth distribution, and solidifies the effective delivery of core public services.
Illustration:
The Public sector realizes tax receipts from individuals and firms and allocates the revenue to build infrastructure such as roads, schools, hospitals, and municipal transit networks. This exemplifies public finance in practice.
2. What Is Taxation?
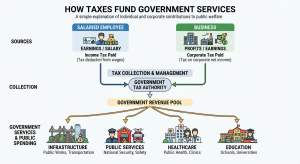
Taxation is the activity via which state authorities mobilize fiscal revenues to underwrite public expenditures and state development. Taxes are one of the fundamental sources of government revenue.
Explanation
Taxation empowers sovereign regulators to capitalize, socioeconomic and strategic infrastructure such as education, healthcare, law enforcement, and national defense. It also functions as a vital fiscal policy instrument to steer market expansion, induce investment, and optimize wealth distribution. Governments impose various categories of taxes relying on economic goals and public necessity. An optimal taxation system secures a sustainable inflow of capital, fostering equity and supporting long-term economic development.
Illustration:
A wage employee remits direct fiscal contributions, whereas corporate entities incur immediate fiscal liabilities on net earnings. These inflows liquidate sovereign administrative expenditures.
3. What Is Direct Tax?
A direct tax is a levy enforced directly on the income streams, wealth, or property of private households and corporate entities. Meaning the targeted entity fully internalizes the coinciding statutory and economic incidence, resulting in the impossibility of tax shifting.
Explanation
Direct taxes are calibrated based on the ability-to-pay principle. Prominent examples encompass individual income tax, corporate tax, wealth tax, and capital gains tax. These fiscal instruments generate crucial public revenue, while simultaneously encouraging an equitable dispersion of wealth. By expanding the domestic tax base without inducing a regressive welfare reduction, direct levies optimize vertical equity relative to indirect taxation.
Illustration:
An employee pays income tax directly to the fiscal authority, calculated relative to annualized gross income, meaning the employee absorbs the final economic incidence.
4.What Is Indirect Tax?
An indirect tax has asymmetric statutory and economic incidence, meaning the fiscal extraction impact can be transmitted from firms to buyers through elevated consumer prices.
Explanation
Commercial enterprises act as intermediary collection agents on behalf of the regulators and collect consumption levies embedded within the final retail value. Prominent manifestations of these consumption-based levies include value-added tax (VAT), goods and services tax (GST), and statutory excise duties. Inasmuch as retail consumers realize the fiscal liability at the point of sale, consumption levies offer high administrative feasibility and generate substantial public inflows.
Illustration:
When a consumer purchases a commodity and incurs sales tax or VAT as part of gross transaction value, commercial enterprise subsequently remits the collected inflows to the fiscal authority. This directly exemplifies indirect taxation in practice.
5.What Is Progressive Tax?
A progressive tax represents a fiscal framework wherein the marginal tax rate escalates concurrently with an increase in an individual’s financial capacity. Under this system, high-earning units remit a greater proportion of their aggregate income to the state, thereby bearing a greater fiscal burden relative to lower-income brackets.
Explanation
Progressive taxation scales tax liabilities relative to an individual’s economic capability. It aims to concentrate tax obligations on high-income groups, minimizing the relative financial strain on lower earners, while easing the overall tax burden on lower-income groups. Regulators use income-proportional tax mechanisms to generate revenue for public works and facilities and social welfare programs, such as education, healthcare, and structural foundations.
Illustration:
An individual income earning $30,000 yearly covers 12% income tax, while another earning $100,000 pays 25%. Such a mechanism serves as a prime manifestation of progressive tax policies
6. What Is Regressive Tax?
A regressive tax is a tax system that disproportionately impacts lower-income workers, who pay a higher percentage share of their income in taxes compared to higher-income individuals, irrespective of a standardized tax obligation or universally applied fixed rate.
Explanation
Regressive taxes impose a more substantial monetary liability on low-income consumers because they expend a larger percentage of their budget on taxable commodities and services. Fiscal levies such as sales tax, excise duty, and fuel tax are frequently categorized as regressive. Although these statutory duties are effective for revenue mobilization and resource allocation, they may exacerbate economic disparity if not complemented by other financial policies.
Illustration:
A sales tax of 13% applies equally to everyone buying goods. Consequently, this structure extracts a larger relative share of financial resources from economically vulnerable low-income households than from high-income earners, making it a regressive tax.
7. What Is Proportional Tax?
A proportional fiscal system, also known as a flat levy, is a taxation regime in which everyone bears the same ratio of income without correlation to how much they earn.
Explanation
Within a proportional fiscal structure, an invariant tax percentage applies universally to every income earner. While it is true that individuals within high-net-worth tranches pay more in aggregate tax because they earn more, the ratio of income paid as levy is the same for everyone.
Illustration:
If each fiscal constituent pays 15% of their earnings as tax, irrespective of their financial strata, the nation operates under a flat-rate taxation regime.
8. What Is Government Expenditure?
Sovereign spending includes the disbursement by the state on community services, infrastructure, management, security, schooling, medical assistance, and economic development.
Explanation
Government expenditure is one of the most important parts of budgetary policy because it impacts economic performance, livelihood, and social welfare. State spending is directed toward developing assets such as critical infrastructure, educational institutions, healthcare systems, and other essential civic amenities while also financing social welfare initiatives and national defense. During an economic recession, governments consequently increase public investment to boost demand and employment opportunities.
Illustration:
A state budget allocates billions of dollars to critical infrastructure, education, and healthcare. These sovereign capital investments are examples of government expenditure.
9. What Is Government Revenue?
Government revenue is the aggregate income collected by a state from tax levies and non-tax revenues to fund social services and economic growth.
Explanation
The state produces revenue predominantly through fiscal receipts, namely: income taxes, sales taxes, customs duties, corporate taxes, and other statutory obligations. They also earn non-taxable revenue streams, namely: fees, fines, public enterprises, natural resources, and investments. Government revenue is vital for funding state budgetary allocations, namely: education, healthcare, infrastructure, defense, and other public services. A stable revenue stream enables the state to sustain economic stability and invest in long-term growth.
Illustration:
A government collects revenue through fiscal receipts, including income taxes, customs duties, and corporate licensing revenues, to finance state services. These receipts signify government revenue.
10. What Is Budget Deficit?
A budget deficit arises when a state’s total budgetary outlay surpasses its aggregate revenue during a specific fiscal year. In this condition, the government expends more money than it accumulates.
Explanation
Budget deficits may occur because of increased public expenditure, low tax revenue, economic crises, or panic situations such as natural disasters. To fund a deficit, states consequently borrow money by floating bonds or taking domestic and cross-border loans. Although controlled fiscal deficits can support economic development during critical time periods, continuous and massive budgetary shortfalls result in elevated sovereign debt and strain future fiscal sustainability.
Illustration:
If a state accumulates $900 billion in revenue but expends $1 trillion, it has a budget shortfall of $100 billion.
11. What Is National Debt?
National debt is the aggregate amount of money payable by the national administration, driven by progressive borrowing. It comprises both domestic and external government debt.
Explanation
National debt high when state recurrently run budget shortfall and fund them via borrowing. It contains of money payable to internal lenders, overseas governments, global financial organizations, and stakeholders who buy treasury instruments. A sustainable level of national debt can help outs economic growth, but large amount of debt may increase borrowing costs, decline investor sentiment, and burden public finances on future Intergenerational.
Illustration:
Cumulatively over years, a state funding infrastructure and social welfare via borrowing. The aggregate unpaid amount payable reflects the state’s national debt.
12. What Is Foreign Debt?
Foreign debt is the money leveraged by the sovereign, corporates, or financial intermediaries from foreign governments, global institutions, or external creditors. It is generally repaid in a foreign currency.
Explanation
Nations’ external debt accumulation from foreign sources to finance development projects, macroeconomic adjustment, or rectifying external imbalances of payments distress. External liabilities may come from organizations like the World Bank, the International Monetary Fund (IMF), or foreign investors. While foreign borrowing yields market access to additional capital inflows, large foreign debt can lead to high debt servicing liabilities and expose a country to exchange rate risks.
Illustration:
A government mobilizes a loan from the World Bank to build structural framework, and energy production. This loan is part of the nation’s foreign debt.
6.International Economics
Global economics is the specialized branch of economics that encompasses international commerce , capital investment, currency dynamics, and transnational economics. It elucidates the mechanisms through which sovereign nations exchange commodities, services, and capital, while evaluating how global economic policy frameworks impact macroeconomic growth, labour markets,and social welfare. Comprehending cross-border economics helps to determine the trajectory of globalization, international trade, and cross-border capital flows.

1.What Is Balance of Trade (BOT)?
Balance of Trade (BOT) is the difference between the aggregate value of a nation’s export and import of goods during a fiscal year. It reflects whether a country has higher commodity outflows than inflows or vice versa.
Explanation
Balance of Trade is an important signal of a nation’s international trade progress. When exports surpass imports, the country has a trade excess, which can power economic development and foreign exchange revenue. When imports exceed exports, the country experiences a negative balance of trade. Governments scrutinize the balance of trade because it impacts local production, the labor market, currency dynamics, and the overall economy.
Illustration:
If a country exports goods worth $400 billion and imports goods worth $300 billion in fiscal year, it has a trade surplus of $100 billion.
Balance of Trade=Total value of Export-Total value imports
BOT=X-M
X=$400
M=$300
BOT= $100
2. What Is Balance of Payments (BOP)?
Balance of Payments (BOP) is a systematic ledger of all financial transactions between a nation’s inhabitants and the rest of the world, typically maintained as an annual financial statement. It encompasses of trade in commodities and services, capital investment, revenue, and cross-border payments.
Explanation
The Balance of Payments allows economic thinkers to calculate a nation’s economic link with rest of the world. It includes the flow of current earnings, capital account, and financial account. A favorable BOP indicates moderate global trade and financial flows, while sustained shortages may reflect economic challenges like high foreign debt or depleting external reserves. Regulators and monetary authorities use BOP data to develop trade and monetary policies.
Illustration:
A state’s exports, foreign capital inflows, inbound tourism revenues, and migrant remittances constitute the primary credit entries in its Balance of Payments.
3. What Is an Exchange Rate?
An exchange rate is the value of one state’s currency articulated in terms of another country’s currency. It resolves how much one currency can be interchanged for another.
Explanation
Exchange rates play a critical role in global trade, the tourism industry, investment, and the foreign exchange market. They impact the prices of imported and exported goods and modify corporate profits and consumer buying power. Global exchange rates may shift because of inflation, interest rates, economic progress, authorities’ policies, and aggregate demand for currencies. States may establish either a pegged or a flexible exchange rate regime.
Illustration:
If 1 US Dollar (USD) = 280 Pakistani Rupees (PKR), then the currency valuation between the US Dollar and the Pakistani Rupee is 1:280.
4. What Is Fixed Exchange Rate?
A fixed exchange rate is an exchange rate system in a pegged regime legal tender is tied to the value of another currency or a composite basket. The central bank sustain this anchor value by interfering in the interbank exchange market when essential.
Explanation
Under a fixed exchange rate regime, the policymakers or the reserve bank sets an official currency valuation and works to keep the legal tender at that level. To achieve this, the monetary authority may buy or sell international tenders and utilize its foreign reserves. A pegged system rate provides greater economic stability in world trade and capital formation because corporations’ face less content economic instability about conversion values.
Illustration:
If a country pegged its currency at 10 units per US dollar, the monetary authority will intervene in the market US dollars whenever essential to maintain that official rate. This is an example of a fixed exchange rate regime.
5. What Is a Floating Exchange Rate?
A flexible exchange rate is a market-driven regime in which the value of a nation’s money is determined by the forces of supply and demand in the currency market, a free-market mechanism.
Explanation
In a free-float conversion rate regime, currency values change in response to in compliance with market fluctuations. Variables such as purchasing power, lending rates, GDP expansion, political certainty, FDI (Foreign Direct Investment), and global commerce impact currency valuation. Floating currency regime autonomously align to changes in the economic situation, making them more flexible than fixed parity systems.
Illustration:
If high foreign direct investment boosts demand for a country’s currency, it gains value without any direct policy action from the monetary authority. To illustrate a key feature of floating exchange rate.
6. What Is Currency Appreciation?
Currency appreciation is an increase in the value of one country’s legal tender relative to another currency. As a result, the investors can buy more foreign units than before.
Explanation
Currency appreciation generally arises because of powerful economic growth, higher policy rates, lower price rises, or increased foreign investment. A stronger capital makes imported goods cheaper for domestic consumers but can decline the global standing of exports because they become more costly for foreign purchasers. State authorities and fiscal authorities monitor currency price rises closely because it impacts international trade, purchasing power, and overall economic progress.
Illustration:
If the trading value changes from 1 US Dollar = 285 Pakistani Rupees to 1 US Dollar = 278 Pakistani Rupees, the Pakistani Rupee has increased because a smaller quantity of rupees is required to purchase one US dollar.
7. What Is Currency Depreciation?
Erosion of currency’s value is a decline in the worth of one country’s monetary unit relative to another country’s currency under a flexible external value of the coinage system. As a result, more local funds are required to purchase foreign legal tender.
Explanation
Currency depreciation can arise because of higher inflation, lower interest rates, political instability, trade shortfall, or decline in foreign direct investment. An unstable currency makes exports more advantageous in global markets because they become cheaper for foreign purchasers. However, it also raises the cost of imported goods and services, which may contribute to inflation. Economic thinkers carefully analyze monetary softening because it impacts trade, investment, and economic development.
Illustration:
If the exchange rate changes from 1 US Dollar = 285 PKR to 1 US Dollar = 300 Pakistani Rupee, the Pakistani Rupee undergoes a parity reduction because more rupees are needed to purchase one US dollar.
8. What Is International Trade?
International trade is the interchange of goods and services between various countries. It permits states to purchase merchandise they cannot produce proficiently and produce goods in which they have an ambitious profit
Explanation
International trade plays a critical role in economic development by enlarging markets, boosting production, generating job opportunities, and promoting technological advancement. Nations participate in trade to procure crude materials and consumer goods that may not be obtainable locally. It also encourages competition, improves product quality, and lowers prices for buyers. However, international trade may also expose internal industries to foreign competition, leading authorities to use trade policies such as tariffs, quotas, and subsidies to protect domestic firms.
Illustration:
Pakistan exports salt and textiles to other countries while importing machinery and petroleum products. These commercial activities are prime examples of international trade.
9. What Is Free Trade?
Free trade is an international trade policy that permits goods and services to flow between countries without government trade barriers, like tariffs, quotas, or import licenses.
Explanation
Free trade helps countries master manufacturing goods and services they can produce more smartly. It fosters intense competition, expands buyers’ choices, and encourages economic development via greater global cooperation. Corporations make more profit from larger markets, whereas consumers gain from an extensive diversity of wares at reasonable pricing. While tariff-free commerce offers many benefits, some local industries may strive to compete with inexpensive imported goods.
Illustration:
Two nations have foster globalized trade by eliminating trade levies on agribusiness goods, enabling growers to export their goods without paying further taxes.
10. What Is a Tariff?
A tariff is a tax implemented by a state on imported or, under particular circumstances, exported goods. Tariffs are used to generate national revenue and shelter local firms from external competition.
Explanation
Authorities impose customs charges to make imported goods more expensive, encouraging buyers to buy domestically manufactured goods. Trade barriers can shield local businesses, create jobs, and reduce the trade deficit. However, increasing tariffs may raise prices for purchasers, decrease global trade, and result in trade conflicts between nations. Analysts frequently argue about the balance between sheltering local firms and encouraging free trade.
Illustration:
A state applies a 20 % tariff on imported steel to help local steel producers. Consequently, imported steel becomes more costly than domestically manufacture steel.
11. What Is Foreign Direct Investment (FDI)?
Foreign Direct Investment (FDI) is an investment made by a firm or person from one state into a corporation or a revenue-producing properties located in another country. It generally involves obtaining proprietorship, launching new operations, or expanding existing setups.
Explanation
Foreign Direct Investment is a key source of economic development and also economic growth because it provides working capital, technology transfer, organizational skills transfer, and job opportunities to the destination country. State administrations frequently promote FDI by providing tax benefits, strengthening the structural framework, and creating investor-friendly policies.
Illustration:
A Japanese automobile company builds a production unit in Pakistan and employs local labor to manufacture mechanized equipment. This investment is an example of Foreign Direct Investment (FDI).
7.Financial Markets
Financial markets are frameworks where persons, corporates, and state authorities trade monetary instruments like shares, debt, and other financial assets. These markets help the circulation of finance between lenders and debtors, facilitate firms raising capital, and support economic development. Grasping financial markets is the foundation for learning how savings are restructured into investments and how economic resources are allocated efficiently.

1.What Is a Money Market?
A liquidity market is a securities market where short-maturity credit assets within a one-year spectrum are exchanged. It provides corporates, banks, and governments with on-demand availability for temporary cash surpluses.
Explanation
The money market is designed to meet short-term capital procurement needs while sustaining increased market depth and comparatively decreasing risk. Standard liquidity market instruments include unsecured corporate notes, time deposits, and negotiable bank obligations. Monetary authorities also use the credit and lending markets to implement monetary policy and regulate liquidity in the banking system. Because investments mature quickly, the wholesale funding markets are categorized as safer than many long-term investment markets, while they usually offer lower returns.
Illustration:
A sovereign issues short-term treasury obligations (T-Bills) with a six-month tenor to borrow short-term funds. Investors buying these securities are transacting within the money market.
2. What Is a Capital Market?
A share market is an equity market where equity instruments like common stock and preferred stock are bought and sold. It facilitates firms’ long-term financing for stocks and expansion.
Explanation
Capital markets are the foundation for economic growth because they yield long-term funding for structural framework, corporate diversification, and firm development. Capital providers partake in the debt market to earn profits through corporate yield, debt returns, or investment returns. Money markets integrate both the primary and secondary markets, where new marketable securities are issued, and the secondary market, where outstanding equities and bonds are traded among investors. Effective equity markets promote savings, induce investment, and foster technological advancement, while improving asset allocation within the economic system.
Illustration:
A firm issues unsecured bonds to fund the establishment of a new production plant. Capital allocators buying these bonds are partaking in the debt market.
3. What Is a Stock Market?
A stock market is an equity market where common shares of publicly quoted companies are bought and sold. It allows corporations to raise capital and permits shareholders to purchase holdings in businesses.
Explanation
The stock market is the financial system. Corporations issue common shares to raise capital for upscaling, while capital providers purchase shares to accrue dividend income and positive returns from capital appreciation in market prices. Equity valuations oscillate based on company progress, investor anticipation, economic situation, and aggregate demand.
Illustration:
A capital provider acquires equity for long-term development through the capital market, speculating that the market price will increase over time. This is an example of deploying funds in the stock market
4.What Is a Bond Market?
A bond market is a financial market where governments, businesses, and other organizations distribute and trade bonds to raise long-term funds. It is also part of economics terms that capital providers purchase bonds in exchange for consistent interest disbursements and the amortization of the face value at maturity date.
Explanation
The bond market is one of the most crucial parts of the capital market because it yields a dependable source of long-term funding for governments and businesses. Bonds are usually deemed less risky than equity because they offer fixed interest income and a contractual maturity date. state governments use bond markets to fund structural programs and public expenditures, while corporations issue corporate bonds to diversify operations and invest in new projects.
Illustration:
A government issues 10-year bonds to fund infrastructure projects. Capital providers buy these bonds and receive coupon payments until the bonds reach maturity.
8. Microeconomic Concepts
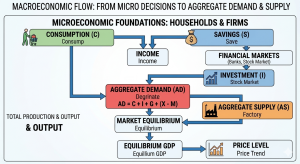
Microeconomic ideas determine how individuals, households, and firms allocate resources for expenditure, financing, and budgeting. Concentrating on particular economic behaviors, these concepts assist in grasping how personal financial decisions impact resource allocation and market consequences.
1. What Is Savings?
Savings refer to the part of income that is not consumed in present spending but is saved for future use. Persons, firms, and state governments save money to ensure financial security and fulfill future needs.
Explanation
Savings are a foundational element of a robust economy because they provide finance for investment and economic growth. Individuals save money for emergencies, education, retirement, or future consumption. Financial organizations use cash deposits from fund holders to provide loans to businesses, supporting entrepreneurship and employment opportunities. Sustaining an equilibrium between saving and expenditure is essential for maintaining economic progress.
Illustration:
A person with a $ 5,000 monthly income spends $3,000 on living expenses and saves the balance of $2,000 into a savings account. This represents a $2,000 per month savings
Saving=Disposable income-Consumptions
Income = $ 5,000
Consumptions = $3,000.
Saving =$2,000
2.What Is Consumption?
Consumption is the use of goods and services by persons or households to compensate their needs and wants. It is one of the maximal parts of economic system and acts as a important role in ascertaining aggregate demand.
Explanation
Consumer spending drives macroeconomic development by creating demand for goods and services. When consumers buy goods like food, clothing, accommodation, conveyance, or healthcare services, firms increase production to meet demand. Higher consumption consequently leads to increased business investment. However, consumption relies on many factors, namely- disposable income, consumer behavior, interest rates, inflation, and government policies.
Illustration:
A family buys groceries, pays electricity bills, buys clothing, and pays for transportation each month. These daily costs are examples of consumption.
3. What Is Investment?
Investment is the process of allocating money to assets with the expectation of generating profit. It is a key drives development and capital formation.
Explanation
Investment plays a key role in both personal funds and the entire economy. People invest in capital like stocks, bonds, real estate, and mutual funds to grow their resources over time. Firms invest in machinery, technological advancement, fundamental research, and hard and soft infrastructure to achieve high productivity and diversification. Policymakers also invest in public programs, namely infrastructure and power systems, to encourage long-term economic growth. Peak levels of investment usually lead to high production, employment opportunities, innovation, and appreciated purchasing power parity.
Illustration:
A producing industry invests $7 million in modern machinery to increase operational efficiency and meet escalating customer demand. This expense is an example of an investment because it is forecasted to create increased profits in the future.
9.Market Structure
In basic economics, market formation refers to the structural organization and characteristics of a market that determine how firms rival, set prices, and generate goods or services. It determines the level of the number of firms, product differentiation, and restrictions to market entry, and restriction to market entry. Grasping market structure facilitates predicting firms’ behavior, productive efficiency, and consumer well-being.
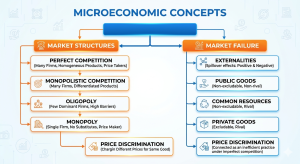
1. What Is Market Failure?
Market failure is a condition in which the free market fails to allocate resources efficiently, such as a situation that does not generate greater social well-being. In such conditions, authorities’ intervention may be critical for enhancing economic growth.
Explanation
Market failure arises when the price dynamics fails to achieve optimal resource allocation. Usual origins contain social costs, state-provided goods, market dominance (such as monopolies), information gaps, and the exhaustion of non-excludable but rival goods. When market distortion exists, goods and services may be in surplus production, deficit production, or highly unequal distribution. Authorities consequently remedy these inefficiencies through regulations, taxes, subsidies, public spending, or competition policies.
Illustration:
Air pollution from factories is a universal illustration of market distortion. Since industries may not absorb the full total societal burden of environmental degradation, they generate more industrial emissions than is welfare-maximizing.
2. What Are Externalities?
Externalities are the expenditures or utilities generated by an economic activity that impact external agents who are not direct stakeholders in the transaction. These affects are not reflected in market value.
Explanation
Externalities arise when the actions of a buyer or seller generate unplanned results for others. They are organized into negative external costs and positive external benefits. Negative externalities, such as environmental degradation and traffic blockage, impose costs on social welfare, while positive externalities, like human capital and merit good, yield additional advantages to the person accruing them.
Illustration:
A fertilizer plant releases smoke that pollutes the surrounding habitat, impacting the local community, which is not a participant in its production process. This is an example of a negative externality. Conversely, the plant constructs new roads and supplies steady energy to the vicinity for its operations. The nearby residents can now use these upgraded roads and energy for free. This is a demonstration of a third-party benefit.
3. What Are Public Goods?
The term public goods refers to goods and services that are non-excludable and non-rivalrous, meaning people cannot easily be prevented from consuming them, and an individual’s consumption does not decrease their availability to others.
Explanation
Public goods are generally given or sponsored by Regulators and monetary authorities because private firms consequently have an incentive to generate them. Given that everyone can benefit without straight disbursing, it is difficult to commercialize individual usage. Common goods encourage social wellbeing and help economic growth by yielding facilities that generate revenue for the whole society.
Illustration:
Territorial integrity, municipal lighting, public places, and coastal beacons are common examples of public goods.
4. What Are Private Goods?
Private goods are refers to goods and services that are restrictable and depletable, meaning buyers must pay them to use them, and one individual’s consumption decreases the amount available for others.
Explanation
Private goods are generated and disposed of by firms in aggressive markets. Because buyers pay for these goods, manufacturers can recoup their output costs and maximize earnings. Most daily goods, like consumer goods, namely food, clothing, electronics, and vehicles, are private goods.
Illustration:
A smartphone bought from a mobile shop is a private good because only the purchaser can use it.
5. What Is a Monopoly?
A monopoly is a market formation in which one firm control the absolute market for a good or service, with no close alternatives and considerable obstacles prohibiting new rivals from infiltrating the market.
Explanation
A Price Maker is a single firm that has total control over the aggregate supply and cost-based pricing of a good or service. In view of the fact that the firm faces no rival sellers, the single producer can impact prices, output, and market dynamics. Monopolies may occur because of legislative protection, proprietary rights to key resources, innovation benefits, or high new venture costs. Governing bodies frequently regulate exclusive sellers through antitrust laws to protect buyers and encourage ethical rivalry.
Illustration:
A government-backed electricity supplier that is the only supplier or national grid operator in a country is an illustration of a monopoly.
6. What Is Monopolistic Competition?
Monopolistic competition is a market structure in which many firms sell similar but differentiated products, allowing each firm to have some pricing power.
Explanation
In imperfect competition, corporates contend by discriminating their goods via quality and quantity, high-class advertising, structure, and consumer care. While several businesses operate in the market, a non-price competition strategy gives each firm restricted market power. Usually, the absence of barriers to entry and exit promotes sustained competition and technological advancement.
Illustration:
Restaurants, clothing brands, coffee shops, and beauty salons, as well as body soap and detergents, are examples of numerous sellers because they deal in the similar but differentiated goods while competing on quality and quantity, branding, and consumer engagement.
7. What Is an Oligopoly?
An oligopoly is a market configuration in which a few industrial giants dominate the marketplace. The strategic choices of each firm impact the measures of its rivals.
Explanation
In an oligopoly, enterprises are deeply interconnected because every firm’s pricing policies, output, and market positioning concepts influence the others. Structural obstacles to access make it challenging for new market players to enter the market. Firms may contend via good quality, technological advancement, high-level branding, or price discovery mechanisms. Oligopolies are prevalent in industries that necessitate significant capital formation and innovation.
Illustration:
The automobile, airline, and smartphone fields of commerce are illustrations of oligopolies, where some massive corporations overshadow the market.
8. What Is Perfect Competition?
Perfect competition is a competitive framework in which countless consumers and producers deal in non-differentiated commodities, and no atomistic seller or buyer has the monopoly control to impact equilibrium price levels.
Explanation
Perfect competition is viewed the most productive market structure in economic concept. It is distinguished by a large number of consumers and producer, undifferentiated products, flexible market entry or exit dynamics, symmetric information, and total mobility of resources. Because the entire industry sells homogeneous products, they must abide by the current market value instead of acting as price makers.
Illustration:
Agricultural markets, like rice or corn farming, are frequently used as examples of a fully competitive market because many farmers sell identical goods at market-clearing prices.
9. What Is Price Discrimination?
Price discrimination is a pricing mechanism in which a firm charges various prices to different consumers for the same goods or service, although the marginal cost of provision continues to be identical.
Explanation
Businesses use customized pricing to increase revenue by setting prices based on customers’ propensity to pay. This mechanism is effective when industries have pricing power, can distinguish among consumer groups, and prevent liquidation among purchasers. Economic analysts categorize price segmentation into perfect, quantity-based, and group-based price separation, determined by how value is calculated.
Illustration:
A cinema charges lower ticket prices for students and senior citizens while charging routine prices to other consumers for the same movie. This is an illustration of price segmentation.
10.Cost and Revenue
Cost and revenue are used by firms to assess productivity and economic progress. Cost refers to the expenses incurred in producing goods or services, while revenue reflects the total money earned from selling those goods or services. Understanding costs and revenues helps firms set prices, control costs, increase profits, and make informed production decisions.
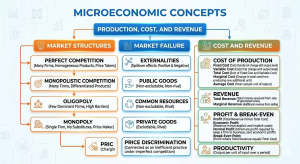
1.What Is Marginal Cost?
Marginal cost (MC) is the extra cost incurred by generating one more unit of a good or service. It helps businesses determine the the most profitable level of production.
Explanation
Marginal cost is a key principle in operational volume and pricing strategy. It comprises the extra costs required to manufacture one supplementary unit, like primary inputs, direct labor, and essential services. A firm compares incremental cost with added revenue to examine the value-generating level of output. When per-unit cost is lower than added revenue, expanding output can maximize profits.
Illustration:
A firm increase output from 600 to 601 units, and total expense increase from $20,000 to $20,050.
Marginal Cost = ($20,050 − $20,000) ÷ 1 = $50
Marginal Cost = Change in Total Cost ÷ Change in Quantity Produced
Change in Quantity Produced=1
Change in Total Cost=$50
New Total Cost= $20,050
Old Total Cost=$20,000
The marginal cost of an extra unit is $50.
2.What Is Average Cost?
Average cost (AC) is the total cost of manufacturing divided by the total number of units generated. It reflects the average cost of yielding one unit.
Explanation
Average cost facilitates firms in measuring productive efficiency and examining proper retail prices. It consists of both indirect and fluctuating cost gaps throughout the entire quantity of units supplied. As output increases, average cost is frequently low because fixed costs are spread over more units. Grasping the mean cost enables businesses to promote budgetary control and prevail contending.
Illustration:
An industry assumes a total cost of $20,000 to generate 1,000 units.
Average Cost = $20,000 ÷ 1,000 = $20
Average Cost = Total Cost ÷ Total Output
Total Cost=$20,000
Total Output=1000
The average cost per unit is $20.
3.What Is Revenue?
Revenue is the total earnings a firm earns from commercializing goods or services before subtracting any costs or taxes. It is frequently identified as total revenue.
Explanation
Revenue is one of the basic economics signs because it reflects how much money a firm generates from its critical workflows. Increased turnover usually shows more robust sales progress, but it does not necessarily indicate that the firm is lucrative, as manufacturing and operating costs need to be considered.
Illustration:
A motorcycle showroom sells 300 motor bike at $10000 each.
Revenue = 300 × $10000 = $3,000,000
Revenue=Price*Quantity sold
Price=$10000
Quantity sold=300
The business earns $3,000,000 in revenue.
4.What Is Marginal Revenue?
Marginal revenue (MR) is the extra revenue a firm earns from produce one additional unit of a goods or service.
Explanation
Marginal revenue helps a business determine the most lucrative level of output. In a highly competitive market structure, differential revenue generally equals the equilibrium price. In imperfect competition, corporations frequently decrease prices to sell additional units, resulting in differential revenue being less than the invoice price.
Illustration:
A firm’s total revenue increased from $60,000 to $60,120 after producing one more unit.
Marginal Revenue = ($60,120 − $60,000) ÷ 1 = $120
Marginal Revenue = Change in Total Revenue ÷ Change in Quantity Sold
Change in Total Revenue=$120
Change in Quantity Sold=1
The marginal revenue from the additional unit is $120.
5. What Is Profit?
Profit is the economic gain a firm earns when its sales turnover surpasses its total costs. It is one of the essential measures of financial success.
Explanation
Profit shows how effectively a firm controls its functions and capacities. An industry gains net earnings when the income produced from sales is higher than the cost incurred in manufacturing and selling goods or services.A Firm uses profit for large-scale operations, deploys resources in new initiatives, distributes dividends, and consolidates long-term growth.
Illustration:
A corporation’s generates $160,000 in total revenue and incurs $120,000 in total costs.
Profit = $160,000 − $120,000 = $40,000
Profit = Total Revenue − Total Cost
Total Revenue=$160,000
Total Cost=$120,000
The company’s profit is $40,000.
6.What Is Economic Profit?
An economic profit is defined as net income after subtracting both direct costs and opportunity costs from aggregate revenue.
Explanation
Different from net earnings, supernormal profit incorporates the implicit cost of applying raw materials. It calculates exactly whether a firm is accruing more than it could have acquired from the next best opportunity to use its resources. A positive economic profit shows that the business is generating extra value, while zero financial profit conveys that the firm is returning only a normal profit.
Illustration:
A firm earns $400,000 in turnover, has $320,000 in direct costs, and $40,000 in implicit costs.
Economic Profit = $400,000 − ($320,000 + $40,000) = $40,000
Economic Profit = Total Revenue − (Explicit Costs + Implicit Costs)
Total Revenue=$400,000
Explicit Costs=$320,000
Implicit Costs= $40,000
The business earns an economic profit of $40,000.
7. What Is Break-Even Point?
The break-even point (BEP) is the primary level of revenue or manufacturing at which a firm’s aggregate income Is equivalent to its total costs, yielding neither profit nor shortfall.
Explanation
The break-even point facilitates firms examine the lowest number of units they must trade to retrieve total output and running costs. It is pervasive utilized in pricing strategy, fiscal planning, and asset valuation. Once escalate the break-even point, the firm start to earn a revenue.
Illustration:
A corporation has supplementary costs of $30,000, merchandises every good for $60, and accrues a flexible cost of $40 per unit.
Break-Even Point = $30,000 ÷ ($60 − $40) = 1,500 units
Break-Even Point (Units) = Fixed Costs ÷ (Selling Price per Unit − Variable Cost per Unit)
Fixed Costs=$30,000
Selling Price per Unit=$60
Variable Cost per Unit=$40
The company must sell 1,500 units to break even.
8. What Is Productivity?
Productivity is the calculation of how effectively factors of production like labor, capital, and technological advancement are utilized to generate goods and services.
Explanation
An increase in economic viability means manufacturing additional production with the identical amount of resources or accomplishing the uniform output using less resources. Upgrade in technological advancement, labor skills, institutional governance, and technology can elevate productivity. Productive efficiency decreases earnings costs, stimulates firm economic efficiency, higher incomes, and leads to long-term economic progress. Economic thinkers regard productivity as an essential determinant of the level of welfare.
Illustration:
An industry manufacturing 1,200 units using 100 labor hours.
Productivity = 1,200 ÷ 100 = 12 units per labor hour
Productivity = Total Output ÷ Total Input
Total Output=1,200
Total Input=100
This means every worker hour produces an average of 12 units.
11. Development Economics
Development economics examines how nations optimize socioeconomic status, decrease poverty, foster sustainable development, and meet long-term financial and poverty reduction goals. It targets revenue disbursement, social welfare, global trade integration, and strategies that help with comprehensive and renewable growth.
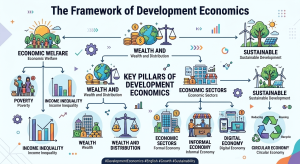
1. What Is Economic Welfare?
Public goods and services are basic economics that indicate the entire well-being and quality of life of people in a society, measured by the accessibility of products, assistance, revenue, clinical infrastructure, primary literacy, and economic prospects.
Explanation
Economic welfare pertains to the standard of living enjoyed by people within an economic system. It relies on factors like rising income levels, job opportunities, access to public services, and the just dispersal of resources. Increased economic well-being usually reflects that people can meet their primary necessities and enjoy a better socioeconomic status. Policymakers frequently upgrade people’s welfare via strategies that encourage economic development, decrease poverty, increase employment opportunities, and improve access to primary healthcare and clinical infrastructure.
Illustration:
Policymakers invest in public healthcare, foundational schooling, and labor programs, elevating societal public infrastructure and increasing economic well-being.
2. What Is Poverty?
Poverty is the condition in which people or households have insufficient earnings and resources to meet their basic necessities, such as food, housing, medical care, basic literacy, and clothing.
Explanation
Poverty poses a critical challenge in both emerging and industrialized countries. It may result from joblessness, substandard pay, socioeconomic divide, inflation, natural calamities, or sluggish economic growth. Regulators and global institutions work to mitigate poverty via employment opportunities, primary literacy, social security, and viable economic strategies.
Illustration:
A family cannot bear the cost of nutrients, secure shelter, or primary healthcare because its earnings are under the marginal living standard. This state exemplifies absolute poverty.
3.What Is Income Inequality?
Income inequality is defined as uneven distribution of revenue among people or consumer units within an economic system.
Explanation
Income inequality arises when some individuals earn substantially more than others. It can be a consequence of the distinctions in schooling, talents, job creation, wealth holdings, innovations, and policymaker strategies. Average income variance may promote output efficiency and technological advancement, but massive inequality can decline economic mobility, increase poverty, and create financial and societal problems.
Illustration:
The leading 20% of households generate a massive proportion of income. The concentration of a nation’s aggregate income, while many domestic units accrue very little, results in income inequality.
4. What Is Wealth?
Wealth is the aggregate value of capital held by an people, firm, or nation after deducting entire unpaid dues or debts.
Explanation
Wealth consists of assets like money, savings, immovable property, equities, treasuries, firms, and premium assets. Unlike income, which is a flow of earnings over a period of time, wealth shows the accrued value of assets over a specific period.
Illustration:
A person owns a house worth $350,000, savings of $70,000, and a portfolio worth $200,000, while managing $200,000 debt obligation. The net worth shows the person’s wealth.
5. What Is Sustainable Development?
Long-term development is the process of achieving economic growth while preserving the environment and ensuring that future generations can fulfill their own basic needs. It integrates economic, social, and environmental targets.
Explanation
Sustainable development encourages long-term well-being by promoting the responsible use of natural resources, reducing environmental degradation, and optimizing social prosperity. It targets clean power, sustainable resource stewardship, enriched schooling, poverty mitigation, and equitable economic progress.
Illustration:
A state invests in renewable energy instead of depending wholly on crude oil. This fosters economic development while minimizing pollution, serving as an example of sustainable development.
6. What Is the Digital Economy?
The digital economy is an economic system that depends on the internet economy involves the utilization of digital technologies for the creation, exchange, and consumption of goods and services. These two paradigms, traditional economics and the cyber economy, are instrumental in shaping the course of worldwide economic progress.
Explanation
The digital economy involves online retailing, internet banking, cashless transactions, web-hosted services, computational intelligence, web-based marketing, and working from anywhere. It boosts firm productivity, enhances access to commercial activities, and generates new job opportunities.
Illustration:
A person consumes goods via an online commercial venue and compensates utilizing an internet-based wallet. This transaction is an example of the digital economy.
7. What Is the Informal Economy?
The informal economy encompasses activities operating outside formal regulatory frameworks, fiscal levies, and statutory enrolment.
Explanation
Firms and laborers in the informal economy frequently do not have formal agreements, legal immunities, or permission to access social welfare. Standard instances consist of event vendors, cottage industries, daily wagers, and unregistered enterprises. Although the parallel economy delivers jobs and income for countless individuals, it may diminish public revenue and curb laborers’ statutory protection.
Illustration:
A stallholder selling fruits without a formal enterprise or tax returns is involved in the informal economy.
8. What Is the Formal Economy?
The formal economy involves entirely lawfully established firms, institutions, and labor that manage rules, government mandates, tax compliance, and adhere to labor and corporate laws.
Explanation
The formal economy involves registered employment, a legislated working environment, and access to perks like retirement stipends, medical insurance, and social welfare. Incorporated enterprises subscribe to fiscal receipts via levies and maintain community services. A powerful official economy boosts economic stability, increases investment certainty, and encourages sustainable long-term development.
Illustration:
A listed production firm that pays taxes on business profits, follows labor rules and laws, and provides fringe benefits operates within the formal economy.
12.Economic Indicators
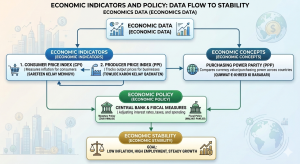
1. What Are Economic Indicators?
Economic indicators are empirical and fundamental tools for analysis that are utilized to review the performance, health, and trend of an economy. They facilitate policymakers, firms, financiers, and economic thinkers to assess the economic situation and make informed decisions.
Explanation
Economic indicators involve key findings about a rise in GDP, inflation, employment opportunities, factors of production, international trade, and consumer sentiment. They are typically organized into dominant barometers, which estimate upcoming economic trends, current economic metrics, which show the current financial state, and confirmatory signals, which validate trajectories after they eventuate. These analytical tools support the government in assessing macroeconomic stability and formulating robust strategies.
Illustration:
An increase in GDP, price stability, and a diminishing unemployed workforce ratio reflect that an economic system is robust. These numerical inputs are illustrations of economic indicators utilized to evaluate economic viability.
2. What Is Consumer Price Index (CPI)?
The Consumer Price Index (CPI) measures the mean variation in the prices of a bundle of goods and services consumed by households over a designated time frame. It is extensively utilized to calculate purchasing power erosion and changes in the cost of living.
Explanation
The Consumer Price Index surveys the prices of usually consumed items, such as cost-of-living categories. Policymakers and monetary authorities use CPI to observe inflation, index wages and stipends, and generate macroeconomic stabilization frameworks. A high CPI signifies escalating inflation, whereas a descending CPI may evince deflation. Because CPI shows fluctuations in household expenses, it is one of the crucial indicators of the macroeconomic environment.
Illustration:
Suppose the value of a bundle goods was $600 in the anchor year and $650 in the assessment period.
CPI = (650 ÷ 600) × 100 = 108.33
CPI = (Cost of Basket in Current Year ÷ Cost of Basket in Base Year) × 100
Cost of Basket in Current Year=$650
Cost of Basket in Base Year=$600
Consumer prices are 8.33% higher than the base year.
3.What Is Producer Price Index (PPI)?
The Producer Price Index (PPI) measures the mean variation in the selling prices that primary processors obtain for their goods and services before they reach the consumer marketplace.
Explanation
The Producer Price Index signals price dynamics at the volume trading or productive output level. It involves commercial goods such as natural resources, processed goods, and secondary sector provisions. Economic thinkers utilize PPI as a prior benchmark of inflation because high output costs consequently precede to higher consumer prices in the future.
Illustration:
If the mean transaction value obtained by producers for steel rises from $900 to $980 per ton, the Producer Price Index shows this is an escalation in wholesale inflation.
4. What Is Purchasing Power Parity (PPP)?
Purchasing Power Parity (PPP) compares the purchasing power of different countries’ currencies by calculating how much the same bundle of goods and services costs in each country.
Explanation
Purchasing Power Parity allows economic thinkers to compare socioeconomic status, Gross National Income, and economic production across countries by adjusting for differences in price levels. Instead of depending only on market conversion rates, PPP evaluates the original PP of each currency. Global institutions like the World Bank and the International Monetary Fund (IMF) often utilize PPP when contrasting the shape and progress of various economies.
Illustration:
If the same bundle of goods priced at $200 in the United States and Rs. 56,000 in Pakistan, the PPP conversion rate is:
PPP = 56,000 ÷ 200 = Rs. 280 per US dollar
PPP Exchange Rate = Price of Basket in Country A ÷ Price of Basket in Country B
Price of Basket in Country A=56000
Price of Basket in Country B=$200
This shows that, based on purchasing power, Rs. 280 has purchasing power similar to US$1 for that bundle of goods.
Beyond Definitions: Contribution to Economic Learning
I grasp that key economic concepts are easily accessible on the webpages. Assessed against the substantial amount of insight in this discipline, my role may appear limited. However, in my view that every genuine effort to share information is valuable. Via this glossary, I have contributed my personal effort and grasp to the study of economics.
Making Economics Easier to Understand
My objective is not merely to gather economic terms and their terminology. I have worked to clarify every key idea in reader-friendly language so that the audience can grasp its purpose and relevance. Real-life examples and visual explanations are also presented wherever they can make the topic easier to comprehend.
Supporting Students, Learners, and Researchers
This glossary aims to provide valuable assistance to scholars, students, economic analysts, and those interested in economics. By examining concepts in a clear and structured way, my goal is to make economic literacy easily accessible and relate it to real-life situations.
A Small Effort Toward a Bigger Purpose
Economics is a substantial and complex field of study that explores markets, human decision-making, efficient use of resources, disparity, economic growth, and economic progress. I do not assert to encompass all aspects of this subject area. I see this glossary as a minor contribution to a broader knowledge base. Just as a single droplet becomes integrated into a larger pool, I intend for my works to become a valuable resource for continued learning. My goal is to promote wonder, deepen understanding, and make economics more approachable to everyone. ab dekho
Conclusion
Grasping economics begins with a clear command over academic economic vocabulary. This economics terminology index has been thoroughly well structured into 12 classifications, making it simple for readers to explore ideas step by step instead of searching through asymmetric information. From basic frameworks and demand and supply to macroeconomics, monetary economics, public finance, global economics, financial markets, microeconomic concepts, market structure, cost and revenue, development economics, and economic indicators, each section is designed to provide an organized human capital development experience.
Whether you want to master basic principles or refresh your skills on sophisticated topics, this collection of 100+ key basic economic serves as a reliable reference for building a strong foundation in economics.
Explore the complete glossary, expand your understanding of essential for basic economics, and strengthen your knowledge of economics—one concept at a time.
References

As an economics writer at Tech and Tips Economy, Siraj Ullah focuses on demystifying economic policies and financial data. His primary goal is to ensure that general economic topics are clear and easy to understand for the everyday reader. By adjusting the depth and length of his articles based on topic complexity, Siraj works tirelessly to bring approachable economic insights directly to his audience.